Friday, December 12, 2014

Calculating Power of Physical Activities

Purpose: The purpose of the lab was to calculate the power used in two different types of activities.

Procedure: The lab consisted of two different types of activities. One of them was walking/running up a flight of stairs and the second one was pulling a weighted backpack using a pulley system.

One of the experiments that we did was pulling up a weighted backpack using a pulley system and checking the time it took us to pull up the backpack as shown below. We recorded the time and the mass of the backpack.


The second experiment was us running up the stairs and walking up the stairs and recording the time it took for us to go up those steps. We recorded the time it took us to climb those steps.


Data; The data we recorded included the mass of the backpack, the times it took for us to do the activities, and we also needed our weight which we got during our own time and we also had to acquire the height of what we were lifting.

Calculations: In order to find the power, we needed the time, height and the weight of the different objects we had to elevate whether it was the backpack or our bodies.

Below is the way I calculated the power of lifting myself up the stairs. First I got my weight and then I divided that over the time it took to get the power.


The second calculation below was for lifting the backpacks. It was the same process as the one before. I got the power to be 49.6 Watts.


Summary; Overall, the lab was successful because we were able to calculate power out of the measure variables we got. By knowing that P = W / t we were able to get the results we needed. The results were that walking up the stars requires more power than lifting something up the same amount of height.

Saturday, December 6, 2014

Collisions (Meter Stick with Clay)

Purpose: The purpose of the lab was to analyze an inelastic collision which involved a meter stick striking a piece of clay and how to use conservation of momentum in order to find how high the meter stick rises.

Procedure: The whole lab involved the use of a meter stick, a piece of clay and a stand from which the meter stick was swinging. The meter stick was pinned at one end so that it could swing from a certain height. We also used Video Capture and Logger Pro in order to compare our experimental results from our derived results. First, we used calculations so that we could come to a result and see whether conservation of momentum would apply to the inelastic collision. Then we would raise the meter stick a certain height and use Video Capture to see how high the meter stick swung. Below is an example of how the experiment looked.


Data: In order to get the numbers for our experiment we measured the the length of the ruler (which was already given), the mass of both the ruler and the piece of clay. Below is the graph of the data that we used for our actual value. The y value showed how high the meter stick went but we had to subtract 20 cm because the initial height of the clay was elevated.


Calculations: The calculations used were to solve for how high the meter stick was going to go. In order to solve for it we used conservation of angular momentum which involved finding the moment of inertia of the meter stick at one end and using that to get the final height.


Summary: Overall the lab was successful because the experimental value was not too far from the actual value. The experimental value was 0.238 m and the one from the graph was 0.280 which was -0.420 meters difference. The error might have consisted of friction between the pin and the ruler and some small air resistance. Also the ruler was supposed to be released from the horizontal position so it might not have been exactly released from that position.

Conservation of Linear and Angular Momentum

Purpose: The purpose of the lab was to see if the angular and linear momentum in a series of different circumstances including both types of motion.

Procedure: Below is the set up of how we had the first and second parts of the experiment set up. The second one in the picture below involved getting a ball and rolling it down from an initial height. Then it would roll down the ramp until it flew it off it and struck a certain point on the ground. The first part involved will allow us to acquire a final speed which in result leads on to the second part. In the second part, instead of the ball falling to the ground, the ball will fall into the ball catcher which is attached to a rotating apparatus and a hanging mass attached to the system as well. From this we will be able to calculate the rotational velocity of the disk and compare and see whether the linear momentum and rotational momentum are conserved.


Data; Since this lab was done in class everyone had gotten the same results. The picture above shows the different measurements that the professor gave to the class. This allowed us to get a final velocity for the system and recorded it as the final rotational velocity. The same data for when the ball was rolling down the ramp was also used.

The graph below shows the results of the disk spinning and the way the acceleration differs every time.


Calculations: The calculations below showed how we came the answer. For when the ball was rolling down the ramp we used Kinetic and Rotational Kinetic Energy and then once the ball left the ramp we used kinematics. The final velocity when the ball was off the ramp was 1.4 m/s and the final speed of the ball before it hit the ground was 1.11 m/s. 


Using the final velocity when the ball was initially off the ramp we were able to get the final rotational velocity of the disk when the ball struck the ball catcher. Using the moment of inertia of the disk and conservation of angular momentum of the impact we were able to calculate the final rotational velocity of the whole system.


Analysis: The differences between the actual and experimental values were really close. If I remember correctly we were below 5% as a class because the lab was done collectively.Overall it was a success because both the speed of the ball at launch and during the collision were very similar. This further proves the fact that linear and angular momentum are conserved if the speed of the ball initially is equal to the same amount in the final velocity.

Tuesday, November 25, 2014

Moment of Inertia of a Triangle

Purpose: The purpose of the lab was to use the angular acceleration of a rotating disk system in order to find the moment of inertia of a uniform triangle on top of the system.

Procedure: In order to check our answer with the final one we get, we decided to start by symbolically calculating the moment of inertia of the uniform triangle. For the lab we had to calculate both when the triangle was up and when it was on its side, both around a center of where there was a hole in the middle of the triangle. We then would use a spinning uniform disk system with a hanging mass at one end in order to find the moment of inertia of the triangle by using the torque of the system. 

A representation of how the system is supposed to look like is shown below.


Data: The first graph we got was by spinning the triangle when it was on its side.


The second graph was when the triangle was standing up. Both gave us a different angular acceleration.


Calculations; Below is how we got the moment of inertia of the triangle by using the parallel axis theorem.


After getting the angular acceleration by using the spinning disk system and Logger Pro we used torque to solve for the moment of inertia of the uniform triangle.


Summary: The overall lab was a success because the calculated moment of inertia was close to the experimental moment of inertia. The error could have been because there might have been some friction between the disks and some air resistance.

Torque and Moments of Inertia (Disk)

Purpose: The purpose of the lab was to calculate the time at which a cart will reach the bottom of an inclined ramp by using the moment of inertia of the apparatus, which in this case was a solid uniform disk with a solid uniform cylinder in the center of the disk.

Procedure: Below is a picture of the disk and cylinder system. The moment of inertia was found by measuring the different parts of the systems like the radius of both the width as well as the diameter and mass.


Below is what the final set up would look like. By finding the moment of inertia of the system, a time can be found for when the cart reaches the bottom.


In order to get the time, the angular deceleration was needed so that the frictional torque of the system could be found. This was done by using Logger Pro with video capture and using a graph to find the angular deceleration of the system. Then we were given a problem where we had to find the time it took for a cart attached to the rotating system to reach the ground at a certain angle. The values were given to us and we solved it like regular problem. It served as a way to help us find the time of the system we had to physically set up.

Data: The data table below shows the information we got from Logger Pro when using video capture in order to find the deceleration of the system.


The graph below shows the angular velocity in the x and y direction which was used to acquire the angular deceleration of the system.


Using the equation Vt = sqrt(Vx^2 + Vy^2), the tangential velocity can be found and the graph below shows how the slope gives that tangential velocity.


Calculations: The calculations below are for how we solved the moment of inertia of the disk and cylinder system. The result was 1.92 x 10^-2 kg*m^2.


The calculations below show how the frictional torque, angular acceleration and the time it took the cart to drop 1 meter were acquired.


Summary: The lab was not a success because the time we calculated was off from what physically got. The ramp's angle in the calculated portion was 46 degrees and the time it took was 9.5 seconds. On the other hand, we physically set the ramp up to try and match that angle but we got about 12.5 seconds instead which is about 24% of error. We believe that the disk-cylinder system was tampered with or it was getting stuck somehow because after doing the trial multiple times the time kept increasing. Below is what the set up looked like at the end.


Angular Acceleration

Purpose: The purpose of this experiment was to see what factors affect the angular acceleration of a specific object which in this case was a solid disk.

Procedure: This picture shows the whole set up of how the lab looked. We had a platform with two spinning disks in which they were allowed to rotate without friction using the hose, with an air source, which was found within the platform. The air flowed in between the disks so that we could allow them not to touch which was meant to simulate no friction. The disks also had a hole in the middle so that air could be let out but since that was not necessary for the experiment, a pin to close up the hole was used. The whole system also had a string attached to the pin and at the end was a hanging mass which was used to help measure the angular acceleration of the disks.


The data was acquired using Logger Pro and the experiment was run multiple times and each of them with specific conditions to show the relationship between angular velocity and time and therefore acquire an angular acceleration. These conditions included changing the weight of the hanging mass, changing the weight of the disks and torque pulley.

DataThe graph below shows an example of one the test trials we did. The data table on the right gives us a set of angular velocity and time.


The graph below shows the actual first trial we did that went into our data.


This graph shows the result of the angular acceleration after doubling the hanging mass.


The final graph we documented was of when we tripled the hanging mass. As seen, the angular acceleration decreases the more the mass is increased.


The chart below shows were all the data was acquired from the graphs. We decided that no more graphs were necessary because all of them have the same picture but with different slopes because the angular acceleration is always different depending on the conditions. 


Calculations: There were no calculations because this lab was to see the relationship between angular velocity and time in order to get the angular acceleration of the whole system.

Summary: Overall, the lab was successful because the trends that are seen make sense. If the hanging mass is doubled then the angular acceleration is doubled and if the hanging mass is tripled then the angular acceleration is also tripled. To add on, if the radius is increased then the angular acceleration increases which makes sense since angular acc = radius x translational acceleration. One more trend was if the weight of the spinning disk is decreased then the angular acceleration is increased.

Friday, October 3, 2014

Relationship between Angular Speed and Angle of the String Above the Vertical for a Particular Rotating Apparatus

Purpose: The purpose of the lab was to find the relationship between the angular speed and the angle of an object undergoing circular motion.

This is the machine we used to acquire all of our measurements. It was composed of a motor that made an object attached to a string at the the end of the top pole move in a circular pattern so that we could see the relationship between the angular speed and angle.


Procedure: We began by setting the motor at different power outputs so that we could get different angles and different angular speeds in order for us to graph them and see the relationship. The machine above was set as shown below. We initially measured the total height, the radius, which in this case was half of the total pole length, and the length of the string. After every single power output for the motor we measured the height of how high the object was from the ground (h2) and the time for every 10 rotations which in other words is the period (T). 


 Data: The data that was mentioned in the procedure is below.


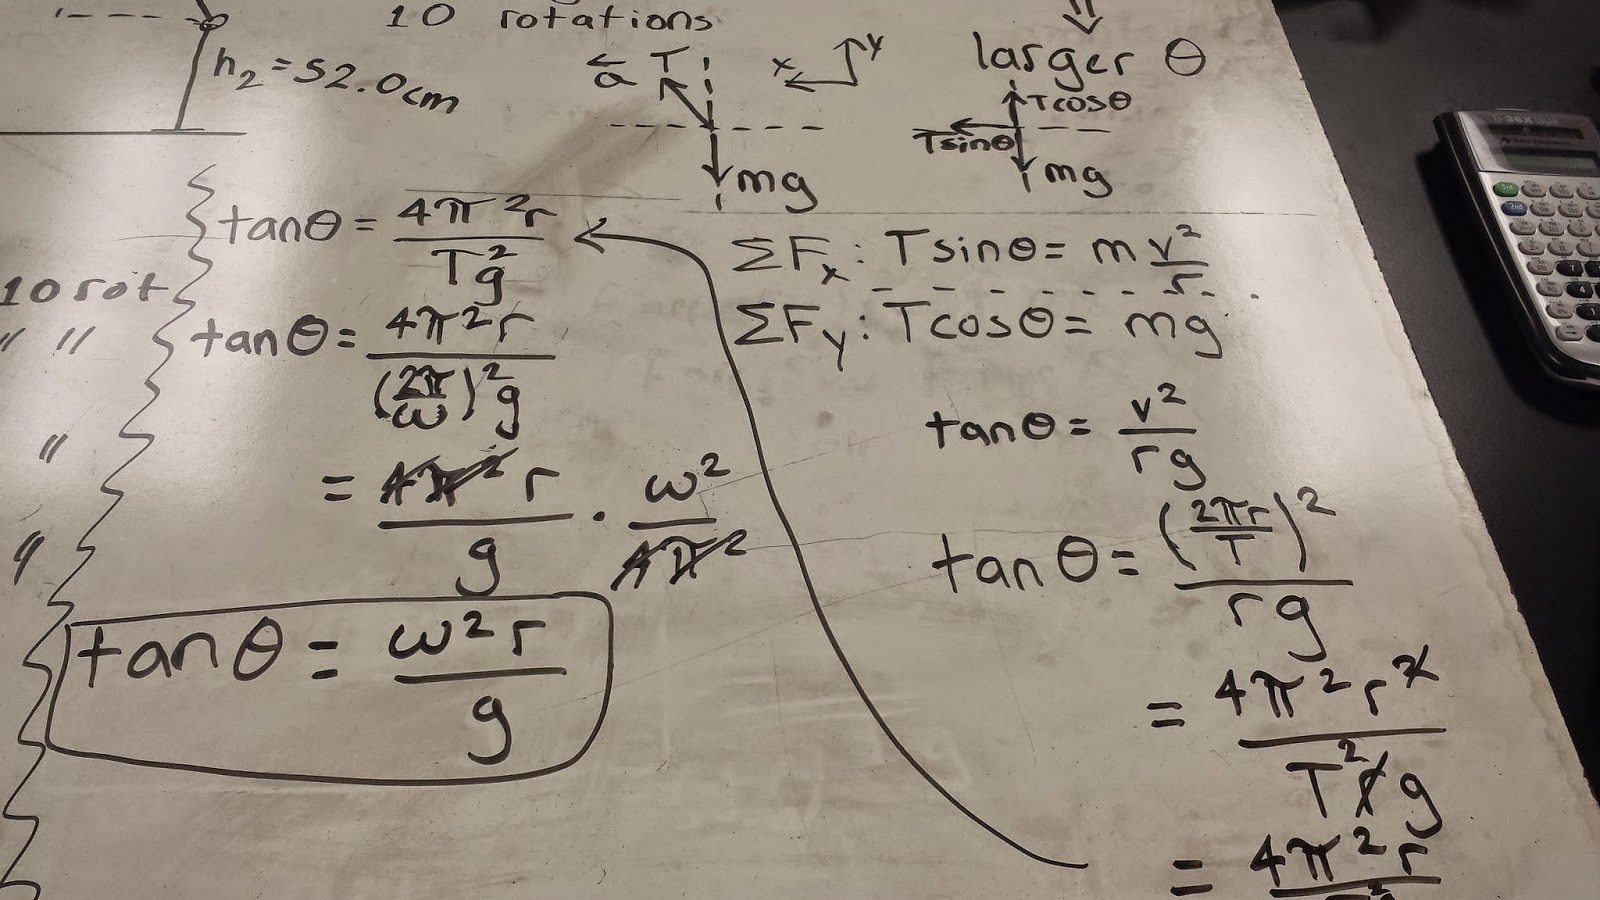
Calculations:  Below are the calculations to how we got the relationship between the angle and the angular speed of the whole system.


Below is the data of how we got the data points for our graph. We did all the actual calculations in Excel.


 Below is the actual graph itself. The slope of the graph is 0.9987 and the expected result was 1 so our answer was 0.0013 off which is really close.


Summary: Overall, this experiment was successful because the experimental and actual result only differed by a 0.0013 difference. This showed us that both the angular speed and the angle of the object have a very close relationship. By measuring the different heights, the angular speed, the radius of the pole and the length of the string, we could calculate the leftover variables in order to get the graph and see the relationship first hand.