This is the machine we used to acquire all of our measurements. It was composed of a motor that made an object attached to a string at the the end of the top pole move in a circular pattern so that we could see the relationship between the angular speed and angle.
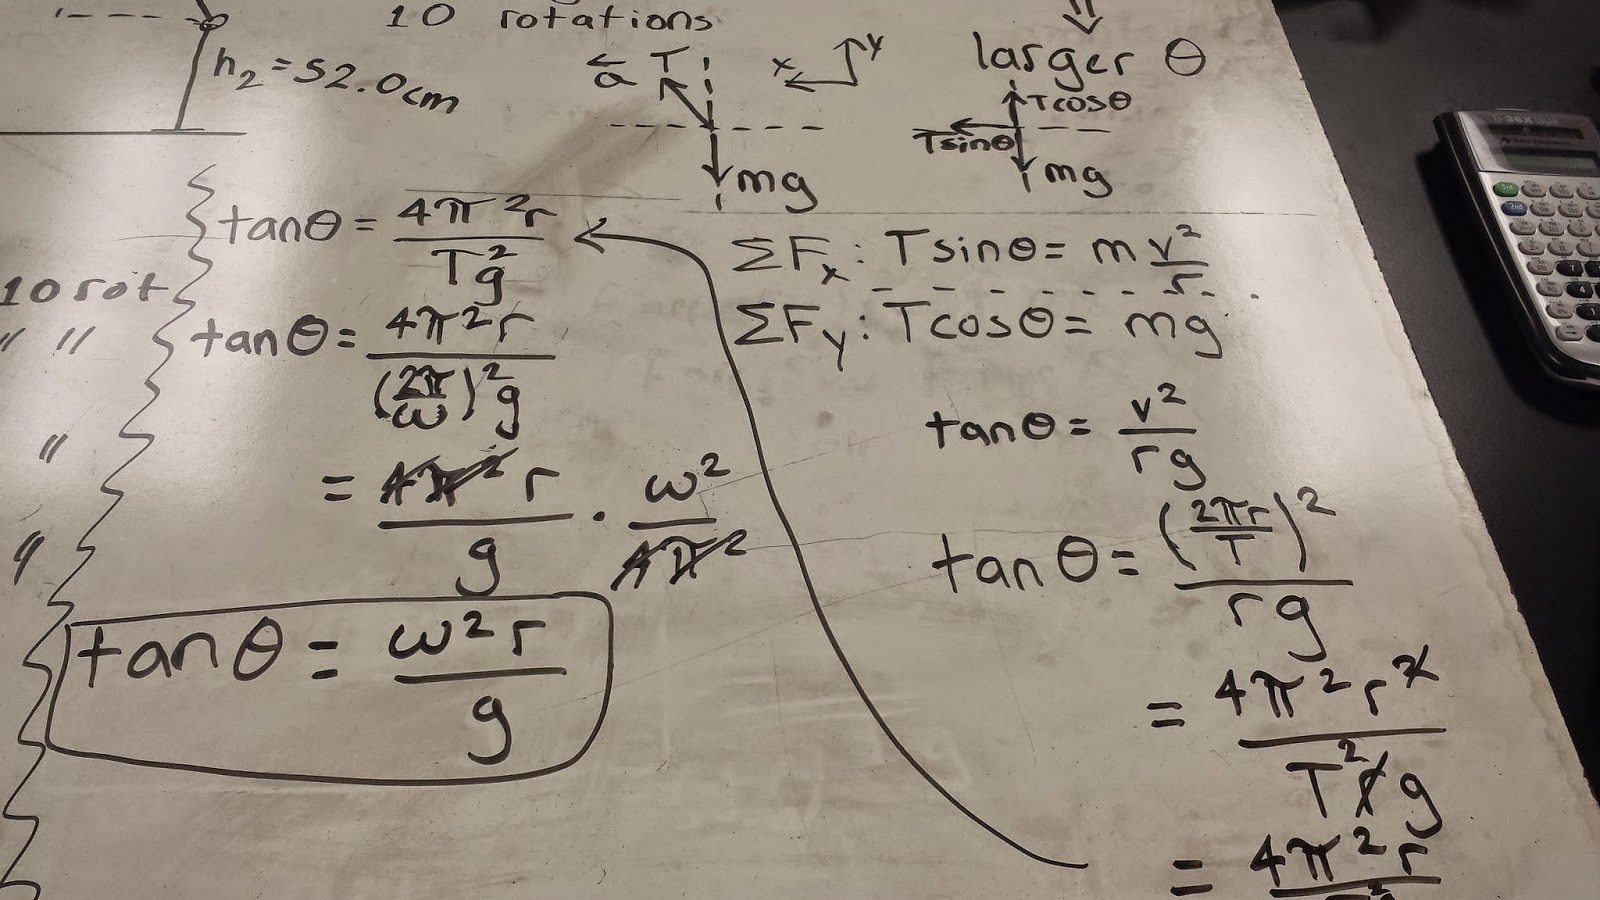
Procedure: We began by setting the motor at different power outputs so that we could get different angles and different angular speeds in order for us to graph them and see the relationship. The machine above was set as shown below. We initially measured the total height, the radius, which in this case was half of the total pole length, and the length of the string. After every single power output for the motor we measured the height of how high the object was from the ground (h2) and the time for every 10 rotations which in other words is the period (T).
Below is the data of how we got the data points for our graph. We did all the actual calculations in Excel.
Summary: Overall, this experiment was successful because the experimental and actual result only differed by a 0.0013 difference. This showed us that both the angular speed and the angle of the object have a very close relationship. By measuring the different heights, the angular speed, the radius of the pole and the length of the string, we could calculate the leftover variables in order to get the graph and see the relationship first hand.


